Is Your
Circuit Testable Really? We offer you constructive reply!
We fulfil thorough testability analysis of
every bit which is the value "0" or "1" assigned to any
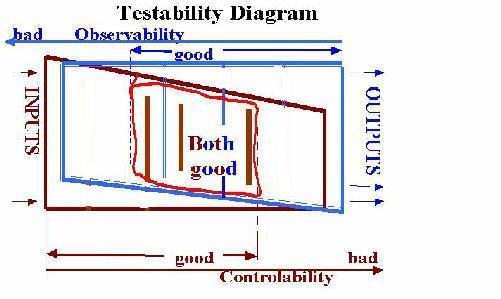
line of your circuit. We calculate two measures per bit (controlability-brown & observability - blue).
We show two histograms of
distribution of
brown &
blue measures upon levels from zero to the worse measure of the maximum
value.

|

|
better==>worse - brown distribution
of controlability - how toil to reach bit from inputs
|
|

|
worse
<==better - blue distribution of observability - how toil to transport bit onto any output
|
|

|
dashed lines show the thresholds below which the ATPG is still
possible thereby measures being good
|
|

|
fault
coverage prediction based upon the testable area surrounded by bright red line where both
controlability & observability measures are good thereof ATPG is possible
|
|

|
in other
words the
testable area or testability is possibility of ATPG
|
If Predicted fault coverage value does not reach of the Permissible quality
threshold then the DFT & TFD for bad circuit will
pass as shown below
|

|
we simulate insertion of extra control pins to select automatically suboptimal set of
control points and to predict new fault coverage
|
|

|
we select extra observable pins by similar approach
|
|

|
we send to customer the
recommended testable modifications to improve his circuit
|
|

|
when
circuit is transformed to the testable one then the TFD passes as below:
|
|

|
verification test may be
generated automatically (optional)
|
|

|
bus consistency analysis
may be done automatically (optional)
|
|

|
high quality test with low level of time consuming should be
generated for the testable project met to our advices
|
|

|
needed test format is
provided as well
|
else the
TFD for good circuit will pass as shown below
|

|
verification test may be
generated automatically (optional)
|
|

|
bus consistency analysis
may be done (optional)
|
|

|
high quality test is to be generated with low level of time consuming
|
|

|
needed test format is
provided as well

|