|
Testable Modifications & Fault Coverage Prediction
 |
with your primary Netlist before DFT Modifications made
|
|
with your secondary Netlist met our advices after DFT Modifications made
|
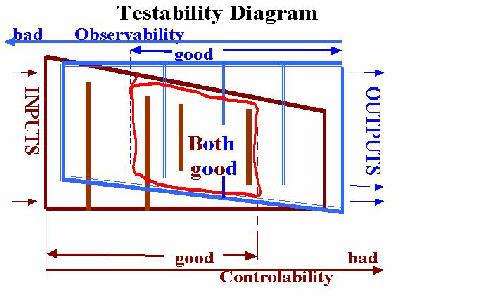
We fulfil thorough testability analysis of every bit which is the value "0"
or "1" assigned to any node of your circuit. We calculate two measures per bit (controlability-brown & observability - blue).
We show two histograms of distribution of brown & blue measures
upon levels from zero to the worse measure of the maximum value.
|
better==>worse brown distribution on controlability - how straitened to reach
bit from inputs |
|
worse <==better blue distribution on observability - how straitened to transport bit onto any output |
|
dashed lines show thresholds below which ATPG still possible thereof measures are good |
|
fault coverage prediction
based upon the testable area
surrounded by bright red line
where both controlability & observability
measures are good thereof ATPG is possible |
|
in other words testable area or testability is possibility of ATPG |
The high quality test should be generated
If testability is bad we offer advices to customer how to improve for circuit testability by inserting testable modifications.

|